


Application Note 17「Analysis of Fc-gamma Receptor-IgG interactions on the Octet platform」
ホワイトペーパー
このカタログについて
| ドキュメント名 | Application Note 17「Analysis of Fc-gamma Receptor-IgG interactions on the Octet platform」 |
|---|---|
| ドキュメント種別 | ホワイトペーパー |
| ファイルサイズ | 1.7Mb |
| 取り扱い企業 | ザルトリウス・ジャパン株式会社 (この企業の取り扱いカタログ一覧) |
この企業の関連カタログ


このカタログの内容
Page1
APPLICATION NOTE 17
Analysis of Fc-gamma Receptor-IgG interactions
on the Octet platform
Renee Tobias, Danfeng Yao, and Sriram Kumaraswamy, ForteBio
Table of contents Introduction
Introduction . . . . . . . . . . . . . . . . . . . . . . . . . . . . . . . . . . . . . . . . . . . . 1 Fc gamma receptors (FcγRs) are membrane glycoproteins with
affinity for the Fc region of immunoglobulin G (IgG). FcγRs ex-
The Octet platform for analyzing Fc gamma receptor/ pressed on the surface of immune effector cells play a key role
antibody interactions . . . . . . . . . . . . . . . . . . . . . . . . . . . . . . . . . . 2 in initiating Fc effector functions such as antibody-mediated
Biosensor selection . . . . . . . . . . . . . . . . . . . . . . . . . . . . . . . . . . . 2 cell-dependent cytotoxicity (ADCC)1, which is a major mech-
anism of action of therapeutic monoclonal antibodies. There
Assay optimization . . . . . . . . . . . . . . . . . . . . . . . . . . . . . . . . . . . . 4 are three classes of FcγRs based on genetic similarity: FcγRI
(CD64), FcγRII (CD32) and FcγRIII (CD16). FcγRI is characterized
Quality of reagents . . . . . . . . . . . . . . . . . . . . . . . . . . . . . . . . . . . . 4 as a high affinity receptor with affinity range of 0.1–10 nM for
Ligand loading step . . . . . . . . . . . . . . . . . . . . . . . . . . . . . . . . . . . 4 IgG, while FcγRII and FcγRIII have lower affinity for IgG (0.1–
10 µM)2. FcγRI binds monomeric IgG as well as immune com-
Analyte concentration/association step . . . . . . . . . . . . . . . . . . 5 plexes, while both FcγRII and FcγRIII bind with greater affinity
Buffer conditions and non-specific binding . . . . . . . . . . . . . . . .7 to IgG complexes. Binding can be affected by genetic polymor-
phisms of the receptors as well as glycosylation patterns in the
Referencing . . . . . . . . . . . . . . . . . . . . . . . . . . . . . . . . . . . . . . . . . . . 8 Fc region of the antibody3,4.
Data acquisition rate . . . . . . . . . . . . . . . . . . . . . . . . . . . . . . . . . . . 9 The ability of therapeutic monoclonal antibodies to bind FcγRs
can greatly impact their safety and efficacy. Induction of ADCC
Biosensor regeneration . . . . . . . . . . . . . . . . . . . . . . . . . . . . . . . .10 by an antibody depends on its binding affinity to both the target
Data analysis . . . . . . . . . . . . . . . . . . . . . . . . . . . . . . . . . . . . . . . . . 12 and to the FcγR. Therefore efforts to analyze and enhance Fc
interactions with FcγRs have become an integral part of biother-
Evaluating quality of the data and fitting . . . . . . . . . . . . . . . . . 13 apeutic development processes. Throughout drug develop-
Measuring affinity of Fc gamma receptors in antibody ment, antibodies are selected, engineered, and assayed for
engineering, comparability studies, lot release assays either improved or reduced binding to Fc receptors depending
and QC. . . . . . . . . . . . . . . . . . . . . . . . . . . . . . . . . . . . . . . . . . . . . . . 13 on their mechanism of action. Effector function is a critical com-
ponent of biological characterization and SAR studies of lead
Conclusion . . . . . . . . . . . . . . . . . . . . . . . . . . . . . . . . . . . . . . . . . . .15 candidates. The FDA requires data on Fc effector function for
References . . . . . . . . . . . . . . . . . . . . . . . . . . . . . . . . . . . . . . . . . . .15 regulatory filings and potency lot release, and Quality Control
groups routinely assay in vitro binding and kinetics of therapeu-
tic candidates to Fcγ receptors in parallel with functional cell-
based ADCC assays. ELISA, FRET, and SPR are commonly used
methods for determining binding affinity of FcγRs to antibodies.
Binding affinities of Fc gamma receptors to monoclonal antibod-
ies can be determined in a high throughput and highly sensitive
format using biosensor analysis on the Octet® platform. Here we
introduce the Octet® platform as the technology of choice for
analyzing Fc gamma receptor-IgG binding interactions. Assay
1
Page2
formatting options and best practices for various biosensor for- Biosensor selection
mats on the Octet system will be discussed, as well as consider-
ations for assay optimization, data acquisition, curve fitting and A primary consideration when developing Fc gamma recep-
analysis of results. tor-IgG kinetic assays on the Octet system is assay format. In
a typical kinetics assay, one of the binding partners is immobi-
lized on the biosensor surface (ligand) and the other remains in
The Octet platform for analyzing Fc gamma solution (analyte) and associates to the immobilized molecule.
receptor/antibody interactions Selection of the appropriate biosensor for an assay and choice
The Octet family of instruments is based on Bio-Layer Inter- of which molecule to immobilize will depend on several factors.
ferometry (BLI), a label-free technology that measures mo- Since FcγR-IgG interactions are often relatively low affinity,
lecular interactions in real time for the purpose of detection, concentrations of analyte for association may need to be quite
quantitation and kinetic analysis. BLI offers many advantages high, often in the micromolar range. In contrast, the ligand
for detailed characterization of Fc receptor/IgG interactions molecule immobilization step is typically performed at lower
in terms of throughput, ease of use, specificity and flexibility. concentrations. Therefore, limitations on availability of reagents
Octet instruments can read up to 96 samples simultaneous- will need to be considered when choosing assay orientation.
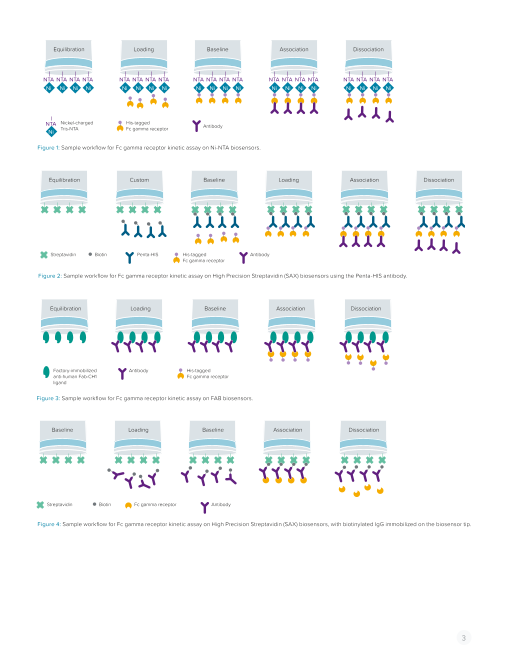
ly in automated format using a standard microplate for rapid Several biosensor options are available for studying FcγR-IgG
determination of binding affinity constants (KD), association rates kinetics, depending on the desired format. When immobilizing
(ka or on-rate) and dissociation rates (kd or off-rate). In addition HIS-tagged FcγRs on the surface of the biosensor, Ni-NTA
to performing complete kinetic characterization, steady-state biosensors can be used. Ni-NTA biosensors have QIAGEN’s
analysis can be used to determine KD, or simple binding assays Tris-NTA charged with nickel (Ni2+) pre-immobilized onto the tip.
performed to evaluate relative affinity. Ni-NTA will bind to a HIS-tag attached to recombinant proteins. In
The microplate format combined with Dip and Read™ biosensors this format, the Fc gamma receptor protein is loaded onto the bi-
enables highly parallel processing on the Octet system in sam- osensor as the ligand, followed by association with IgG. A sample
ple volumes as low as 40 µL. Throughput on the Octet system workflow for a Ni-NTA kinetic assay is shown in Figure 1. Since
is much higher than SPR instruments, with faster time to results, nickel can also bind weakly to non HIS-tagged proteins, non-spe-
minimal sample consumption and virtually no instrument mainte- cific binding to the IgG analyte may occur when using Ni-NTA bi-
nance. Reagents in microplate wells can be re-used throughout osensors to immobilize FcγRs. Blocking and buffer conditions can
an assay, enabling the same antibody sample to be measured be optimized to minimize these interactions, and are discussed in
against multiple FcγRs (or vice-versa) for reagent savings or the Buffer conditions and non-specific binding section.
platform assay development. Multiple Dip and Read biosensor Risk of non-specific interactions can be reduced by using an
options from ForteBio enable flexible assay formatting. Biosen- antibody specific for HIS-tagged proteins to capture FcγRs on
sors are cost-effective and do not require regeneration, saving the biosensor. QIAGEN’s Penta-HIS antibody is highly sensitive
additional assay development time. In contrast with endpoint and specific for HIS-tagged proteins. This antibody can easily
assays such as ELISA or FRET which yield only a single readout be biotinylated for immobilization onto High Precision Strepta-
per sample, real-time biosensor analysis provides significantly vidin (SAX) biosensors, or purchased pre-conjugated to biotin.
more vital information about a molecule’s activity than equilib- Penta-HIS antibody immobilized on SAX biosensors can then
rium data alone. Time savings and simpler processing mean be used to capture HIS-tagged FcγR ligand in the loading step,
faster time to results when compared with the multiple incuba- followed by association with IgG analyte. An example workflow
tion and wash steps required for ELISA or the complex assay illustrating use of biotinylated Penta-HIS antibody for capture of
development for FRET assays. Wash steps are not required with HIS-tagged FcγRs in a kinetics assay is shown in Figure 2.
BLI due to the high level of specificity provided by biosensor
chemistries, eliminating the risk of losing low-affinity binders For the reverse assay orientation in which IgG is immobilized on
during repeated wash steps that can occur with ELISA. the biosensors and FcγR protein remains in solution as analyte,
the recommended biosensor selection is Anti-Human Fab-
The Octet RED96e, RED384 and HTX systems offer the best CH1 (FAB). The FAB biosensor incorporates a high-specificity
performance for kinetic analysis and are the recommended anti-human Fab-CH1 ligand molecule pre-immobilized on the
platforms for analysis of Fc gamma receptors. These three surface. The high specificity of the biosensor towards the CH1
instruments have suitable sensitivity for measuring low-affinity region of human IgG allows the capture and immobilization of
interactions with fast association rates, which are characteristic all four subclasses of human IgG. This capture method is highly
of many FcγR-IgG interactions. specific and reliable for analyzing FcγR-IgG kinetics, and is
more conducive to a platform-approach when testing multiple
IgGs and receptors. Capture of IgG is oriented, creating a more
homogeneous surface on the biosensor. The Fc hinge region
is exposed with minimal steric hindrance for receptor binding
(Figure 3).
2
Page3
Equilibration Loading Baseline Association Dissociation
NTA NTA NTA NTA NTA NTA NTA NTA NTA NTA NTA NTA NTA NTA NTA NTA NTA NTA NTA NTA
Ni Ni Ni Ni Ni Ni Ni Ni Ni Ni Ni Ni Ni Ni Ni Ni Ni Ni Ni Ni
NTA Nickel-charged His-tagged
Ni Tris-NTA Fc gamma receptor Antibody
Figure 1: Sample workflow for Fc gamma receptor kinetic assay on Ni-NTA biosensors.
Equilibration Custom Baseline Loading Association Dissociation
Streptavidin Biotin Penta-HIS His-tagged Antibody
Fc gamma receptor
Figure 2: Sample workflow for Fc gamma receptor kinetic assay on High Precision Streptavidin (SAX) biosensors using the Penta-HIS antibody.
Equilibration Loading Baseline Association Dissociation
Factory-immobilized Antibody His-tagged
anti-human Fab-CH1 Fc gamma receptor
ligand
Figure 3: Sample workflow for Fc gamma receptor kinetic assay on FAB biosensors.
Baseline Loading Baseline Association Dissociation
Streptavidin Biotin Fc gamma receptor Antibody
Figure 4: Sample workflow for Fc gamma receptor kinetic assay on High Precision Streptavidin (SAX) biosensors, with biotinylated IgG immobilized on the biosensor tip.
3
Page4
An alternative to capture via HIS tag or Fab region is biotinyla- long periods, especially at very high or very low concentrations,
tion of IgG or receptor for immobilization directly onto SAX should not be used. Careful consideration should be given
biosensors (Figure 4). This approach is particularly useful when to storage conditions and handling of receptor proteins and
the protein being immobilized is not a full-length human IgG, but multiple freeze-thaw cycles should be avoided.
another Fc-containing protein such as an Fc-fusion protein or an
antibody from another species. The biotin-streptavidin coupling Ligand loading step
method creates a stable surface on the biosensor similar to
covalent coupling, yet requires minimal optimization. Biotinyla- The amount of ligand immobilized (loaded) onto the biosensor
tion is simple to perform, gentle on proteins and performed in can have significant impact on the results of a kinetic assay.
solution phase at neutral pH. The reaction is easily controlled For either Fc gamma receptor assay orientation — receptor
by regulating the number of biotin molecules added to the immobilized or antibody immobilized — loading as much protein
reaction per target protein, thus preventing activity loss due to as possible onto the biosensors in order to maximize signal is
over-modification. A 1:1 molar coupling ratio is recommended. not necessarily the best approach. An excess of ligand mole-
Refer to ForteBio Technical Note 28, Biotinylation of Proteins for cules bound to the biosensor can lead to data artifacts due to
Immobilization onto Streptavidin Biosensors for information and crowding, steric hindrance, avidity and mass transport effects.
procedures for protein biotinylation. Weaker, non-specific interactions can also be favored, espe-
cially at higher analyte concentrations, when the biosensor is
Use of SAX biosensors is recommended over the amine over-loaded. These artifacts can impact the observed binding
covalent coupling approach using AR2G biosensors when kinetics. If, however, not enough ligand is immobilized, the sig-
working with Fc receptors. Immobilization with amine coupling nal for the analyte association step may be too low, giving poor
is difficult to control, involves several steps, and requires a pH signal-to-noise ratio. Ideally, loading levels should be optimized
optimization step. The resulting random orientation of receptor for every receptor and biosensor format used.
molecules on the biosensor surface can interfere with activity
via steric restriction of access to binding sites or even confor- We have found that when analyzing FcγR-IgG kinetics, ligand
mational changes in binding sites. This interference is often re- loading strategy will differ depending on the assay orientation
flected in low signal and sub-optimal kinetics5. Oriented capture and the biosensor used. The density of the ligand molecules on
via HIS tag on the Fc receptor protein offers a more robust and the biosensor tip depends on ligand concentration and loading
homogeneous binding kinetics assay. If the antibody is to be step time. When capturing HIS tagged FcγR protein on the
immobilized, FAB biosensors or SAX biosensors with biotinyla- biosensor using Ni-NTA or the biotin-Penta-HIS approach, using
tion are preferred over AR2G. a low density of receptor ligand will yield better results. Using
the biotin-Penta-HIS approach, biotinylated Penta-HIS antibody
Assay optimization is first immobilized onto SAX biosensors using a concentration
5 µg/mL for 10 minutes. For the subsequent Fc gamma receptor
As with any kinetics assay, it is crucial to perform proper assay loading step, using 50–100 nM receptor and a loading step time
development when analyzing FcγR-IgG interactions so that of five minutes is recommended. The loading response should
resulting affinity and kinetic constants will be accurate, reliable reach no more than 0.3–0.4 nM. This relatively low density of
and reproducible. Quality of kinetic data depends on using receptor on the biosensor tip will improve association-dissocia-
optimal conditions for the biosensor format and the binding tion kinetics and help mitigate avidity effects and/or non-specif-
pair. Consideration must be given to assay components such ic binding. Use the ‘threshold’ setting in Octet Data Acquisition
as ligand loading density, analyte concentrations, buffer software to assure receptor loading does not progress too
conditions, and assay step times. The data must be examined far. Figure 5 shows kinetic analysis of FcγRI and IgG1 on SAX
to ensure results are in agreement with what is known about biosensors with Penta-HIS antibody using decreasing FcγRI
receptor and target and the nature of the binding, and loading concentrations, which yield decreasing signal response
evaluated for secondary, non-specific interactions. in the loading step and progressively lower density of receptor
molecules on the biosensor tip. The 1:1 kinetic curve fitting is im-
Quality of reagents proved with lower loading density, as indicated by how closely
the curve fit lines follow the data traces.
Reagent quality is a critical factor with any kinetics assay,
especially for FcγR-IgG interactions. Aggregation of the When using FAB biosensors to immobilize IgG, i.e. the reverse
antibody or receptor can impact kinetics due to increased assay orientation, optimal results are achieved with a higher
avidity. Dimeric and multimeric IgG have been shown to level of ligand loading. The recommended concentration
dissociate much more slowly from FcγRs and require lower of antibody to use for loading onto FAB biosensors is 200–
concentration for the same level of binding than monomeric 500 nM, with loading for 5–10 minutes to achieve a 2.0–3.0 nM
IgG6,7. Antibody samples should be fully evaluated for purity, response. We have found that for the FAB assay format, the
activity and quality using analytical techniques before use in a kinetics and curve fitting results obtained using higher loading
kinetics experiment. Reagents that have been stored at 4°C for levels are similar to those using lower loading levels, with
improved reproducibility at higher loading.
4
Page5
FcγRI Loading Step Response = 2 nm When loading biotinylated IgG or FcγR directly onto SAX
1.2 biosensors, loading conditions should be optimized for
each experimental system. An assay development step or
scouting step in which the biotinylated ligand is titrated on the
biosensors is recommended. To perform a loading optimization
experiment, load several concentrations of biotinylated ligand
0.8 on the biosensor for 5–10 minutes. Following a 2–5 minute
baseline step in buffer, perform an association step for each
ligand concentration using a single high concentration of
analyte (5- to 10-fold above the KD), followed by dissociation in
assay buffer. The optimal loading concentration to select for
0.4
a detailed kinetic analysis is the lowest ligand concentration
that yields an acceptable response in the analyte association
step (see the Analyte Concentration/Association Step section).
The selected loading concentration should not saturate the
0 biosensor or cause changes in the association or dissociation
0 40 80 120 160 200 240 280
Time (sec) kinetics compared to lower concentrations. Examples of
such changes are the appearance of secondary binding in
FcγRI Loading Step Response = 1 nm
the association curve (caused by non-specific interactions)
1.2 or decreased dissociation rate (caused by avidity). Generally,
the less ligand loaded on the biosensor the better, as long as
analyte signal is sufficient. Ligand loading strategies are listed
according to biosensor format in Table 1.
0.8
Analyte concentration/association step
In the association step, the rate of binding of the analyte
to the immobilized ligand is measured. For simple binding
0.4 assays or qualitative analyses, measuring binding curves for a
single analyte concentration can be sufficient. However, when
accurate kinetic and affinity constants are required, a dilution
series of four to six analyte concentrations must be measured
in the association step. Multiple analyte concentrations enable
0
0 40 80 120 160 200 240 280 global curve fitting, where all the traces in a data set are fit
Time (sec) simultaneously to yield one set of results. This assures more
FcγRI Loading Step Response = 0.3 nm accurate and reliable results. The analyte dilution series
in a full kinetic characterization should ideally range from
0.4 concentrations of about 10*KD down to about 0.5*KD, using
2-fold or 3-fold dilutions. Running several concentrations will
also show how well the fitted binding model applies over a
0.3 concentration range around the KD. The analyte concentration
KD=1.91x10⁻⁸ range to use will also depend on the sensitivity of the assay and
+/-1.56x10-10 affinity of the interaction. For high-affinity FcγR-IgG interactions,
it may not be possible to see signal at or below the KD. In this
0.2
case, choose a series of analyte concentrations that cover the
range of the assay, from 10–20 fold above the KD down to the
limit of measurement.
0.1
Low-affinity FcγR-IgG interactions tend to be in the 0.1–10 µM
KD range. Using analyte concentrations well above the KD may
be high enough to create some artifacts in the data. It is best
0 to choose an analyte concentration range that works for the
0 100 200 300
Time (sec) binding pair, for a low affinity binding pair this may start as low
as 5-fold above the KD with 2-fold dilutions down to the limit
Figure 5: Association/dissociation kinetics of IgG to FcγRI with decreasing load-
ing densities of FcγRI ligand. SAX biosensors with biotin-Penta-HIS antibody for- of measurement. FcγR-IgG interactions tend to also have fast
mat was used. Comparison of data fitting using 1:1 model shows visually improved on-rates (>1E5 M-1s-1), where the primary binding interaction
fitting with lower loading levels.
5
Binding (nm) Binding (nm) Binding (nm)
Page6
SAX + Biotin– Amine Reactive
Anti–Human Penta–HIS High Precision Anti–Penta–HIS Second-
Biosensor Fab–CH1 (FAB) antibody Ni–NTA (NTA) Streptavidin (SAX) (HIS) Generation (AR2G)
Recommended High and low High and low High and low affinity High and low Not recommended, Not recommended.
for affinity receptors. affinity receptors, receptors. Lower affinity receptors, though sometimes
Check for cross– except FcγRIIa. affinity receptors may including FcγRIIa. used off–label for
reactivity with give low signal in kinetics assays.
FcγRIIa and association step. Use for high
FcγRIIIb. and low affinity
receptors, except
FcγRIIa.
Molecule IgG HIS–tagged FcγR HIS–tagged FcγR Biotinylated FcγR HIS–tagged FcγR
immobilized or biotinylated IgG
on biosensor
(ligand)
Ligand loading Higher Loading Lower Loading Lower Loading Depends on ligand. Lower Loading
strategy For biotinylated
eg. 200–500 nM 50–100 nM for 50–100 nM for 5 min IgG immobilization 50–100 nM for
for 5–10 min 5 min start with 5 min
200–300 nM for
10 min. Use lower
concentration for
biotin–receptor
immobilization.
Recommended 2.0–3.0 nM 0.3–0.4 nM 0.3–0.4 nM Must be optimized. 0.3–0.4 nM
loading
response
Recommended 1X Kinetics Buffer 1X Kinetics Buffer 1X Kinetics Buffer, 1X Kinetics Buffer, 1X Kinetics Buffer
buffer may need to be may need added
optimized by BSA (up to 1%) and/
increasing salt and/or or Tween-20 (up
Tween-20 to reduce to 0.05%).
NSB.
Blocking Typically not Typically not May be required, Typically not Typically not
required required recommend dipping required required
into 0.2% casein
in assay buffer for
5 minutes after
loading step.
Regeneration Regenerate Regenerate down Regenerate with with Can be Regenerate
conditions down to original to Penta–HIS 10 mM glycine, pH regenerated down to original
biosensor antibody with 1.5 and NiCl2 re– down to biosensor
chemistry with 10 mM glycine, charging. Small loss immobilized ligand. chemistry with
10 mM glycine, pH 1.5. in loading signal can Regeneration 10 mM glycine,
pH 1.5. be expected with conditions pH 1.5.
each cycle. may require
optimization.
Regeneration 6–10 cycles 6–10 cycles Depends on receptor Depends on ligand 6–10 cycles
cycles stability, must be stability, must be
tested. tested.
Special May need to use • Prior to • Check for non– • Biotinylate Can be used like
considerations High Concentra- HIS–tagged specific binding. ligand protein SAX + Penta–HIS
tion Kinetics mode receptor load- Optimize buffer using 1:1 molar antibody, however
(10 Hz ing, immobilize and blocking coupling ratio. these biosensors
data acquisition biotin– penta– conditions • Loading condi- are qualified for
rate) to capture HIS antibody by if needed. tions should be quantitation appli-
initial data for fast loading at 5 µg/ • If signal is low in optimized. cations only and
on–rates. mL for 10 min. association step, may have higher
• For low affinity increase loading drift and variability
receptors, use concentration or in kinetics assays.
short associa- step time.
tion step time, • For low affinity re-
30–60 sec- ceptors, use short
onds. association step,
30–60 seconds.
Table 1: Summary of Fc gamma receptor assay strategies for various biosensor formats.
6
Page7
will quickly reach equilibrium. When the interaction is fast, the Buffer conditions and non-specific binding
association step should not be run for too long — particularly
when formatted in the receptor-immobilized orientation (SAX For Fc gamma receptor kinetics assays, we recommend using
with Penta-HIS antibody or Ni-NTA biosensors). During a long ForteBio Kinetics Buffer as a sample buffer, which is available as
association step, weaker non-specific interactions may begin a 10X solution. This buffer contains the blocking agent bovine
to be favored once the primary interaction has equilibrated. serum albumin (BSA), and a surfactant (Tween-20) to inhibit
This secondary binding can lead to heterogeneity in the non-specific binding to the biosensor tip and to other proteins.
binding curves, which will impact the data fitting. To avoid All samples (ligand and analyte) should be diluted in 1X Kinetics
heterogeneous association curves caused by secondary Buffer, and baseline and dissociation steps should be run in this
binding, it is best to limit the association step to 30–60 buffer as well.
seconds, as long as curvature is observed in the traces Non-ligand-loaded FAB biosensors and SAX biosensors
at higher analyte concentrations. Limiting the time of the with biotin-Penta-HIS antibody tend to exhibit minimal non-
association step can improve fitting with a 1:1 binding model. specific binding to IgG in Kinetics Buffer, primarily because the
Low affinity interactions can also exhibit low binding response method of ligand capture is highly specific. Adding BSA (up to
in the association step. Assay signal is dependent on several 1%) or Tween-20 (up to 0.05%) can sometimes improve data
factors, including affinity of the interaction, size of the quality when using SAX biosensors with biotin-IgG directly
analyte, size of the ligand, reagent quality, ligand loading immobilized. Since any histidine-containing protein can bind
density, buffer components and biosensor chemistry. For weakly to Ni-NTA, Ni-NTA biosensors are prone to binding
protein kinetics, responses that equilibrate at 0.01 nM or non-specifically to IgG and other proteins. If Ni-NTA biosensors
below are approaching the noise level of the instrument are used to capture HIS-tagged FcγR, it is important to check
and generally cannot be fit reliably. When running a full for non-specific binding (NSB) of IgG analyte to the biosensor
kinetic analysis where four to six analyte concentrations surface. Run a preliminary experiment where IgG is associated
must be measured for global fitting, enough signal must be to a biosensor that is not loaded with FcγR ligand. A positive
generated that even the lowest analyte concentration is still signal in the association step indicates the analyte is binding
above the detection limit of the assay. When responses are directly to the biosensor (Figure 6).
low, minor changes in the data can significantly skew results If background NSB signal is minimal, it can be subtracted during
and fitting becomes less reliable. As a general guideline, data analysis by double referencing (see Referencing section).
the association signal for the highest analyte concentration However, significant NSB will impact the apparent kinetics of the
should be 0.4 nM or higher. Optimization steps can be taken interaction and must be mitigated by adjusting assay conditions,
to improve low binding response such as increasing ligand such as modifying the assay buffer and/or adding a blocking
loading concentration, increasing analyte concentration, or step after ligand loading. Adding a greater amount of Tween-20
optimizing buffer conditions. Orienting the assay so that the Fc (up to 0.05%), or increasing the salt concentration can increase
receptor is immobilized on the biosensor and IgG is analyte in the stringency of the binding and help decrease non-specific
solution can also be an effective way to improve signal in the signal. However, these approaches may also decrease binding
association step.
7
6
5
FcγRI Loading
4
Association of Dissociation
IgG Analyte in Buffer
3
2
1
NSB
Buffer only
0
0 100 200 300 400 500 600 700 800 900 1000 1100 1200 1300 1400 1500 1600 1700 1800 1900
Time (sec)
Figure 6: Non-specific binding (NSB) of IgG to Ni-NTA biosensors. Loading step for bottom (non-ligand-loaded) trace was run in Kinetics Buffer instead of FcγRI ligand.
The high concentration of IgG was associated to the non-ligand-loaded biosensors. NSB is indicated by positive signal in the IgG association step for the non-li-
gand-loaded biosensor, shown by arrow.
7
Binding (nm)
Page8
Loaded/unloaded
Loaded biosensor Unloaded biosensor response ratio
Buffer/blocking agent (response in nm) (repsonse in nm) (signal/nsb)
Kinetics buffer 0.13 1.13 0.1
Kinetics buffer with 0.2% Casein blocking 0.41 < 0.01 > 41
Kinetics buffer with his-ubiquitin blocking 0.22 < 0.01 > 22
10 Mm imidazole in kinetics buffer 0.10 0.05 2.0
1 M nacl in kinetics buffer 0.14 0.19 0.7
0.5 M nacl in kinetics buffer 0.10 0.31 0.3
0.05% Tween in kinetics buffer 0.20 1.32 0.2
0.1% Tween in kinetics buffer 0.20 1.45 0.1
Table 2: Performance of different buffer and blocking conditions to reduce non-specific binding of IgG to Ni-NTA biosensors in a FcγRI kinetic assay. Maximum signal
response from the IgG association step (nm) is listed for both FcγRI-ligand-loaded and non-FcγRI-loaded Ni-NTA biosensors. IgG association response for biosensors
without FcγRI represents the level of non-specific binding (NSB). While several methods decreased NSB response, most also decreased binding to FcγRI, yielding
a poor signal/NSB ratio. The most effective method in this example was blocking with 0.2% casein in assay buffer, which eliminated NSB while preserving the actual
binding to the receptor.
of antibody to the receptor in the association step, so must be Background binding can also occur as a result of cross-
tested prior to running the assay. Increasing BSA concentration reactivity between some FcγRs and the molecules pre-
or blocking with BSA is not recommended when FcγR is immo- immobilized on the biosensors for ligand capture. Human
bilized, since the large size of the albumin protein compared to FcγRIIa is known to bind to mouse IgG18, and therefore will
FcγR could result in steric interference. We have not had good bind to the Penta-HIS antibody, which is mouse IgG1. FcγRIIa
results with added BSA. Dipping the loaded biosensor into a and FcγRIIIb also appear to cross-react with the antibody
solution of blocking agents such as casein (0.2%) or HIS-tagged fragment pre-immobilized on FAB biosensors. Some of this
ubiquitin (0.5 µg/mL, EMD Millipore) after loading the receptor cross-reactivity may be mitigated by buffer optimization or
ligand can be very effective in reducing NSB. blocking, but should also be taken into consideration when
choosing an assay format. For FcγRIIa assays, using Ni-NTA or
Table 2 summarizes results from an experiment testing multiple SAX biosensors with biotinylated IgG or a biotinylated receptor
buffer and blocking conditions for reducing non-specific binding as ligand is recommended. Recommended buffer and blocking
of IgG to Ni-NTA biosensors. The extent of the non-specific conditions are summarized by biosensor in Table 1.
binding in this particular assay is apparent in the Kinetics Buffer
sample. In this sample, IgG binding to the unloaded biosensor
(no FcγRI) is nearly 10-fold higher than binding response on the Referencing
FcγRI-loaded biosensor. Increasing sodium chloride to 0.5 M or A reference sample must always be included in a FcγR-IgG
1 M significantly reduced NSB, however the binding response of kinetic assay to allow subtraction of assay drift. A reference
IgG to the FcγRI loaded biosensor is unacceptably low in these sample is a sample with no analyte added in the association
buffer conditions. Adding a low concentration of imidazole also step, i.e. a buffer-only negative control. The reference sample is
lowered NSB but affected loading of receptor onto the biosen- run on a biosensor that is ligand-loaded. When using a cap-
sor (not shown). Increasing Tween-20 did not affect NSB. When ture-based biosensor such as FAB, or when immobilizing bio-
a 5-minute blocking step with 0.2% casein in assay buffer was tin-Penta-HIS antibody onto SAX biosensors, there will be some
added to the assay after the loading step, non-specific binding background level of dissociation of the captured IgG ligand
was eliminated with adequate signal maintained for IgG associ- from the pre-immobilized capture molecule. This background
ation (>0.4 nM). Different buffer conditions can be more or less dissociation must be subtracted out using a buffer-only refer-
effective depending on the receptor and antibody binding pair, ence sample. Double referencing with both a reference sample
so testing a small panel of conditions, as demonstrated in this and a reference biosensor can be performed when there is a
experiment, is recommended. A combination of buffer modifi- small amount of non-specific binding. A reference biosensor is
cations, such as increasing both salt and Tween-20 by a smaller a biosensor dipped into buffer or irrelevant protein instead of
amount may also be helpful. Since the Octet instrument enables ligand during the loading step. It is then run through a replicate
processing of 8 to 16 samples at a time, this entire optimization assay using the same analyte samples as the ligand-loaded
can be done in a single experimental run (approximately a biosensors (Figure 7). Reference biosensors enable subtraction
20-minute assay).
8
Page9
of non-specific binding of analyte to the biosensor. A separate effect is observed and affects curve fitting, the data acquisition
reference biosensor should be included for every sample/ana- rate can be increased to enable more rapid reporting of binding
lyte concentration when performing double referencing. data. The data acquisition rate refers to the number of binding
signal data points reported by the Octet system per second
Data acquisition rate and is reported in Hertz. A higher acquisition rate generates
more data points per second with less averaging, and monitors
Because Fc gamma receptor-IgG interactions often have fast faster binding events better than a slower acquisition rate. The
binding rates, the standard rate of data acquisition (5.0 Hz, rate setting can be changed in the Advanced Settings box
averaging by 20) in Octet Data Acquisition software may not be in the Run Experiment tab in Octet Data Acquisition software
the ideal setting for measuring kinetics. When data is acquired (Figure 8). Select the acquisition rate for High Concentration
by the Octet system, there is a small delay from when the Kinetics (10.0 Hz, averaging by 5). Data collected at a higher ac-
biosensor dips into the sample to when the first data points are quisition rate may have lower signal-to-noise ratio and appear
reported to allow the software to average the collected data. noisier than data collected at the standard rate. Acquisition rate
When binding is very fast, this delay can cause the reported sig- should always be determined based on consideration of the
nal for the association step to initiate well above the baseline, binding rate, the amount of signal generated in the assay as
leading to inaccuracies with curve fitting in data analysis. If this well as experimentation with the settings.
Biosensor tray Sample plate
1 2 3 4 5 6 7 8 9 10 11 12 1 2 3 4 5 6 7 8 9 10 11 12
A A
B B
C C
D D
E E
F F
G G
H H
Ligand biosensors Assay buer FcγR analyte (dilution series)
Reference biosensors Antibody ligand Reference sample (assay buer)
Assay Step Sensor column Step name Sample column Step type
1 1 1 Equilibration 1 Custom
1 2 1 Loading 2 Loading
1 3 1 Baseline 3 Baseline
1 4 1 Association 4 Association
1 5 1 Dissociation 3 Dissociation
2 1 2 Equilibration 1 Custom
2 2 2 Loading 1 Loading
2 3 2 Baseline 3 Baseline
2 4 2 Association 4 Association
2 5 2 Dissociation 3 Dissociation
Figure 7: Assay protocol for an experiment on FAB biosensors with the Octet RED96 instrument that utilizes double referencing. A reference sample is included in the
association step that contains assay buffer with no analyte to correct for baseline drift. Reference biosensors enable subtraction of non-specific binding, and are an
additional set of biosensors that are run through a replicate assay. All steps are repeated on reference biosensors except the ligand loading step, which is performed
in buffer. When Double Reference is selected in the Octet Data Analysis software Processing window, both Reference Sample and Reference Biosensor data will be
subtracted from sample data.
9
Page10
Biosensor regeneration sensors with the same procedure. After regeneration, Ni-NTA
biosensors must be recharged with 10 mM NiCl2 for one minute,
Regeneration of biosensors in kinetic analysis can offer then loaded with new HIS-tagged receptor. Regeneration infor-
savings on biosensor costs and provide a cost-effective mation is summarized by biosensor in Table 1.
method for generating replicate data for ligand-analyte pairs.
Efficient regeneration requires removing the bound analyte If regeneration is successful, the analyte binding curves follow-
or ligand-analyte complex without affecting the activity of ing each regeneration cycle will overlay with minimal change
the biosensor. The number of regeneration cycles that can in response when compared to earlier binding cycles. Figure 9
be withstood is biosensor- and protein-dependent; some shows the overlay of data for association of IgG1 to FcγRIIIa
can be regenerated ten or more cycles, while others tolerate immobilized on SAX biosensors with Penta-HIS antibody. Six
far fewer cycles or cannot be regenerated at all. A standard kinetic assay cycles were run using the regeneration procedure
regeneration procedure for biosensors used for studying described earlier performed between each cycle. When associ-
FcγR-IgG interactions is exposure to a 10 mM glycine (pH 1.5) ation and dissociation steps for each cycle are overlaid, binding
regeneration buffer for five seconds followed by assay buffer response does not decrease but remains consistent across all
for five seconds, and repeating for a total of four exposures to assay cycles. The %CVs for the kinetic and affinity constants
regeneration buffer. Utilizing this protocol on FAB biosensors calculated for each assay cycle are well below 10%.
will remove IgG ligand-FcγR complex, restoring the original In some cases, binding capacity may decrease during
biosensor chemistry. New IgG samples can then be loaded for the first regeneration cycle but stabilize for the remaining
measuring another interaction. cycles. To avoid this initial change, a pre-conditioning step is
When using SAX biosensors with Penta-HIS antibody for cap- recommended where one regeneration cycle is performed
turing HIS-tagged FcγR, the receptor ligand and IgG analyte will before beginning the assay. The number of regeneration
be removed, regenerating down to the level of the Penta-HIS cycles that can be performed successfully in an assay will be
antibody. New Fc receptor ligand can be loaded immediately biosensor- and reagent-dependent, and should be tested for
after regeneration without loading more biotin-Penta-HIS anti- each experimental system.
body. FcγR-IgG complex can be removed from Ni-NTA bio-
Figure 8: Changing the data acquisition rate. In Octet Data Acquisition software under the Run Experiment tab, click the pull-down menu for Acquisition rate and select
Fast Kinetics (10 Hz, averaging by 5). Acquisition rate should be determined based on binding rate, amount of signal generated and experimentation.
10
Page11
Regeneration Regeneration Regeneration Regeneration Regeneration Regeneration
A Assay Assay Assay Assay Assay
Cycle 2 Cycle 3 Cycle 4 Cycle 5 Cycle 6
7
6
5
4
3
2
1
0
1200 1400 1600 1800 2000 2200 2400 2600 2800 3000 3200
Time (sec)
B Association Dissociation C Association Dissociation
0.8 0.8
0.6 0.6
0.4 0.4
0.2 0.2
0 0
0 20 40 60 80 0 20 40 60 80
Time (sec) Time (sec)
D
Average %CV
KD 1.95E-06 7.9
Kon 6.36E+04 5.7
Koff 0.124 3.1
Figure 9: Biosensor regeneration in Fc gamma receptor kinetic assays. A) Raw data: biotin Penta-HIS antibody was immobilized on High Precision Streptavidin (SAX)
biosensors, followed by a pre-conditioning step, then six kinetic assay cycles with regeneration. For each kinetic assay, HIS-tagged FcγRIIIa was first captured onto
Penta-HIS antibody, then association and dissociation steps performed to a 2-fold dilution series of IgG1. B) Overlay of IgG1 association/dissociation steps. C) Curve
fitting of data traces, using a 1:1 model with global fitting and a 5-second dissociation step (fit lines are in orange). D) Table of average kinetic and affinity constants with
CV’s for the 6 regeneration cycles.
11
Binding (nm)
Binding (nm)
Binding (nm)
Page12
Data analysis A
0.30
The most accurate affinity constants are determined in a kinetic
assay when global data fitting is used with several (four to six)
analyte concentrations. Octet Data Analysis software offers
several pre-programmed curve fitting models for analysis of
binding data. 0.20
The kinetic and affinity constants that are calculated will depend
upon the binding model selected. The stoichiometry of the
interaction of FcγRIIIa and FcγRII with IgG Fc has been demon-
strated to be 1:1 in structural and sedimentation studies9,10,11. 0.10
Asymmetrical binding of a single receptor to Fc to both heavy
chains causes minor conformational changes that prevent a
second receptor molecule from binding12. Since other FcγRs
are thought to bind Fc by a similar mechanism with one receptor 0
to one IgG stoichiometry, a 1:1 binding model is the most biolog- 0 20 40 60 80 100
ically relevant model for fitting Fcγ receptor-IgG interactions. Time (sec)
However, the data sensorgrams for these interactions, espe-
cially FcγRIIIa-IgG, often show complex binding attributes which B
confound 1:1 model fitting. Some of the complex or biphasic 0.30
binding exhibited can be eliminated experimentally by lowering
the amount of receptor or antibody ligand on the biosensor and
by shortening the association step to 30–60 seconds. Even
with these adjustments, however, the 1:1 binding model may 0.20 KD = 1.33 x 10⁻⁶
± 2.87 x 10⁻⁸
not provide a good quality fit. Some researchers opt for using
the 2:1 heterogeneous ligand model because the fitting tends
to be improved over the 1:1 model. However, selecting the 2:1
model assumes that the immobilized binding partner (ligand) 0.10
has two independent binding sites with different affinities for
the analyte. This assumption is not consistent with what has
been demonstrated with FcγR interactions with IgG. Data for
FcγRIIIa-IgG kinetics will also fit a ‘conformational change’ or
Two-State model (currently not provided in Octet Data Analysis 0
software) yet it is unclear that this model is the correct way to 0 20 40 60 80 100
Time (sec)
interpret the kinetics. While minor conformational changes have
been shown to occur at the binding site between FcγRIIIa, b C
and IgG Fc upon complex formation, there is limited evidence
to show that conformational change is part of the mechanism
of signal transduction for Fc receptors. Rather, cross-linking
of receptor molecules upon binding to multivalent immune
complexes appears to be the primary mechanism for intracellu-
lar activation3,10,13. The complexity in the binding traces may be
caused by multiple factors such as non-specific interactions or
aggregation of the antibody creating sub-populations of high-
er-affinity multimers.
With appropriate assay optimization and data analysis tools,
some of which have been discussed above, kinetic off-rates and
on-rates can be calculated even for difficult to fit interactions.
The 1:1 binding model can often be fit successfully to complex
and low-affinity FcγR-IgG data when the data acquisition rate is
increased and only a portion of the dissociation step is included
in the analysis. Truncating the dissociation step to 5–10 sec- Figure 10: Comparison of data fitting strategies. FAB biosensors were used to
capture human IgG for a binding kinetics assay with FcγRIIIa using several con-
onds enables the initial dissociation rate in a biphasic curve to centrations. The 1:1 model was used to determine affinity constant, KD, using the
be captured so that fitting is improved and reproducible off-rate full dissociation step (A) and 5 seconds of the dissociation step (B). Steady-state
analysis of data was also used to determine KD (C).
and KD values can be calculated (Figure 10a, b). Using a truncat-
12
Binding (nm) Binding (nm)
Page13
ed dissociation step for curve fitting is most useful for ranking Measuring affinity of Fc gamma receptors in
purposes, when reagents are being compared to each other or antibody engineering, comparability studies,
to a reference sample to examine loss or gain of activity. lot release assays and QC
Steady state values are often used when reporting KDs for The Octet system provides a user-friendly platform that enables
low-affinity receptors such as FcγRII or FcγRIIIa. Steady-state rapid assay optimization, and integrates readily into workflows
analysis can provide an accurate KD value, and is especially use- at many stages of antibody drug development — from early
ful for analyzing interactions that are of low affinity or have very phase candidate selection to release of marketed product.
fast on-rates. Steep initial slopes or complexity in the binding In the development stage, it is important to differentiate the
curves are often more reliably analyzed using steady state rath- most promising candidates early in the process. Antibody
er than kinetic analysis. However, it is important to consider that engineering technologies are constantly advancing to improve
the steady state method is an endpoint analysis that delivers the clinical effectiveness of monoclonal antibodies. Effector
an equilibrium binding constant. Desirable kinetic information is functions may be modified by engineering the Fc region
left out, and on-rates and off-rates are not calculated. Tools are to improve or reduce binding to FcγRs. Detailed analysis
available in Octet Data Analysis software for performing steady- of both kinetics and binding affinity to FcγRs is essential to
state data analysis. The steady-state responses (where the understanding the activity and safety of drug candidates and
sensorgram plateaus in the association step) for various analyte guiding further design strategies. Studies to demonstrate
concentrations are calculated using the R-equilibrium (Req) comparability are of critical importance in development of
function and plotted vs. analyte concentration. The resulting biosimilar monoclonal antibody products. Equivalence of
binding isotherm is fitted using the Langmuir model to calculate materials needs to be established in terms of quality, safety and
the equilibrium constant KD (Figure 10c). efficacy, including full comparison of immunological properties
between a biosimilar and a licensed originator product. Fc-
Evaluating quality of the data and fitting associated functions must be characterized as a component
When developing an assay it is important to look closely at of comparability exercise14. Fc gamma receptor binding can
data traces and assess the quality of the data being analyzed. be impacted by product degradation. Forced degradation
Consider noise level, shape of the traces, signal level at equi- studies are designed to generate product-related variants
librium, number of data points being assessed, and whether and develop analytical methods to determine the degradation
there is even spacing between curves in a titration. Look for products formed during long-term storage. In addition, the
heterogeneity in the binding which can be reduced by optimiz- manufacturing of biotherapeutics requires continual certification
ing experimental conditions. Primary considerations in assay of every lot of product produced. GMP-compliant batch release
development are loading concentration/loading density, buffer and stability assessments must be performed that address
composition, and assay step times. Check for non-specific the criteria of purity, concentration, consistency, and safety,
binding to the biosensor. Be sure reagents are of good quality including evaluation of effector function. Fc gamma receptor
and have not been stored under conditions that would cause binding kinetics assays, where appropriate, can potentially
degradation or aggregation. serve as a surrogate measure of ADCC when correlation can be
established.
Once good quality data has been acquired and processed
and the curve fitting performed, check the analysis for good- In order to demonstrate Fc gamma receptor kinetic assays on the
ness of fit. Visually inspect the data to determine whether the Octet system as a feasible platform for performing comparability
fit lines conform well to the data traces. Individual traces that studies and lot release testing assays, the methods of analysis
deviate from the pattern shown by other traces in a titration described here were used to compare affinities of Fc gamma
can be excluded from the analysis, as well as traces that show receptors to IgG samples on the Octet RED384 system. First,
weak response. Exclusion of analyte concentrations outside ‘stressed’ antibody samples were generated with altered affinity
the working range of the analyte titration will improve fitting in for FcγRIIIa. Humanized monoclonal IgG1 was incubated with
global analysis. Residual values, which are calculated in the re- EndoS de-glycosylase enzyme (Remove-iT EndoS®, New England
sults table and plotted by Octet Data Analysis software, should Biolabs), which cleaves the chitobiose core of the N-linked
ideally be less than 10% of the maximum response of the fitted glycan at Asn297 of the IgG heavy chain. Removal of this glycan
curve. Error values also indicate the reliability of calculated is expected to reduce IgG binding to most Fc gamma receptors
kinetic and affinity constants. Errors are considered acceptable due to more closed conformation of the Fc region14. After removal
if they are within one order of magnitude of the rate constant of the enzyme and buffer exchange, de-glycosylated hIgG was
value. The R2 value indicates how well the fit and experimental mixed with un-modified hIgG at varying amounts to generate
data correlate. R² values above 0.95 are indicative of a good fit. samples that contained 10%, 25%, and 50% de-glycosylated
Chi2 (χ²) is the sum of the squared deviations, and is a measure antibody. The affinity to FcγRIIIa was measured for each of these
of error between experimental data and the fit line. Chi2 is also samples using the Octet RED384 instrument. SAX biosensors
provided in the data analysis results table and should generally with immobilized biotin-Penta-HIS antibody were used to
be a value below three (χ² < 3). capture HIS-tagged FcγRIIIa (R&D Systems), then associated to
13
Page14
A
0.8 0.8
0.4 0.4
0 0
0 40 80 120 0 40 80 120
Time (sec) Time (sec)
0.8 0.8
0.4 0.4
0 0
0 40 80 120 0 40 80 120
Time (sec) Time (sec)
B
1.6E-6
% Deglycosylation KD (M)
0 8.68E-07
10 9.89E-07 1.4E-6
25 1.13E-06
50 1.52E-06
1.2E-6
1.0E-6
8.0E-7
0 10 20 30 40 50 60
% Deglycosylation
Figure 11: Results of kinetic analysis of deglycosylated hIgG1 binding to FcγRIIIa. Affinity of deglycosylated samples to FcγRIIIa was measured using High Precision
Streptavidin biosensors with Penta-HIS antibody to capture the HIS-tagged receptor. Analysis was performed using 1:1 global fitting with a portion of the dissocia-
tion step (5 seconds). A) Fitted data for each sample. B) Calculated KD plotted against % deglycosylation, showing a clear relationship between glycosylation level
and affinity.
14
Binding (nm) Binding (nm)
KD (M)
Binding (nm) Binding (nm)
Page15
a 2-fold dilution series of each hIgG1 sample. Global fitting was methods can potentially be adapted to function in comparability
performed to each set of analyte concentrations to calculate KD studies and qualified or validated GMP lot release and stability
and kinetic constants, using a 1:1 fitting model with a portion of studies. Careful assay development and experimental design
the dissociation step (5 seconds). will consistently yield data that is reproducible and of high
quality, making the Octet system ideal for cost-effective, label-
Figure 11 shows the fitted data and analysis from the kinetics
free kinetic analysis to complement functional assays and
experiment. The results demonstrate that a decrease in
replace more cumbersome label-free methods such as SPR.
calculated KD correlates with an increased percentage of
de-glycosylated IgG in the sample. A change in affinity was
measured in this experiment even in the 10% de-glycosylated References
sample, which showed a 12% decrease in KD compared to 1 Fcγ Receptors as Regulators of Immune Responses, Nimmerjahn, F and
un-modified IgG (KD = 990 nM vs. KD = 871 nM). The entire Ravetch, JV, Nature Reviews Immunology, 8, 34–47, 2008.
experiment was performed in a single 45-minute automated run 2 IgG Fc Receptors, Ravetch, et al., Annu Rev Immunol, 19,
275–290, 2001.
on the instrument plus approximately 45 minutes assay set-up
3 Structural Recognition of Immunoglobulins by Fc Gamma Receptors, Sun, P,
time, using 80 µL of sample per well in a 384-well plate. This in Ackerman, M and Nimmerjahn, F (Eds.), Antibody FC: Linking Adaptive and
experiment illustrates the ease with which a sensitive assay can Innate Immunity, Elsevier, Waltham, MA, 131–144, 2013.
be developed on Octet systems for measuring differences in 4 Specificity and Affinity of Human Fcγ Receptors and Their Polymorphic Vari-
affinity of FcγR-IgG interactions, even for lower affinity receptors. ants for Human IgG Subclasses, Bruhns, P et al., Blood, 113(16), 3716–3725,
2009.
5 Use of Surface Plasmon Resonance to Probe the Equilibrium and Dynamic
Conclusion Aspects of Interactions between Biological Macromolecules, Schuck, P,
Annu Rev Bioph Biom, 26(1), 541–566, 1997.
Measuring accurate and reliable kinetics of interactions 6 Affinity and Kinetic Analysis of Fc Gamma Receptor IIIa (CD16a) Binding to
between Fc gamma receptors and monoclonal antibodies can IgG Ligands, Li, P et al., J Biol Chem, 282(9), 6210–6221, 2007.
be challenging, but is a critical application in many stages of 7 Dimers and Multimers of Monoclonal IgG1 Exhibit Higher in Vitro Binding
Affinities to Fcγ Receptors, Luo, Y et al., MAbs, 1(5), 491–504, 2009.
biopharmaceutical development. The Octet platform offers
8 Mouse and Human Neutrophils Induce Anaphylaxis, Jönsson, F et al., J Clin
a rapid, flexible, and sensitive solution for measuring these Invest, 121(4):1484–1496, 2011.
interactions, whether performing full kinetic analysis, steady 9 The 3.2-A Crystal Structure of the Human IgG1 Fc Fragment-FcγRIII Complex,
state analysis or measuring relative binding. Here we have Sonderman, P et al., Nature, 406, 267–273, 2009.
described methods for producing high quality FcγR kinetic 10 Structural Basis of the Interaction between IgG and Fcgamma Receptors,
data on the Octet system using a variety of assay formats, with Kato, K et al., J Mol Biol, 295(2), 213–224, 2000.
recommendations for assay optimization and data analysis. 11 Stoichiometry and Thermodynamics of the Interaction between the Fc Frag-
ment of Human IgG1 and its Low-affinity Receptor FcγRIII, Ghirlando, R et al.,
Considerations such as biosensor selection, assay orientation, Biochemistry, 34, 13320–13327, 1995.
choice of buffers, ligand immobilization and regeneration 12 A Conformational Change in the Fc Precludes the Binding of Two Fcγ Re-
conditions can all impact results. Fc gamma receptor kinetic ceptor Molecules to One IgG, Koichi, K et al., Immunol Today, 21(7), 310–312,
assays on the Octet platform can be extremely useful for 2000.
evaluating Fc receptor binding activity of antibodies produced 13 Signal Transduction by Immunoglobulin Fc Receptors, Sánchez-Mejorada G
and Rosales C, J Leukoc Biol, 63(5), 521–33, 1998.
from different clones, different production processes or 14 Recognition of IgG by Fcgamma Receptor. The Role of Fc Glycosylation and
prepared in different formulations. We have shown how these the Binding of Peptide Inhibitors, Radaev S and Sun P, J Biol Chem, 276(19),
16478–83, 2001.
ForteBio ForteBio Analytics (Shanghai) Co., Ltd. Molecular Devices (UK) Ltd. Molecular Devices (Germany) GmbH
47661 Fremont Boulevard No. 88 Shang Ke Road 660-665 Eskdale Bismarckring 39
Fremont, CA 94538 Zhangjiang Hi-tech Park Winnersh Triangle 88400 Biberach an der Riss
888.OCTET-75 or 650.322.1360 Shanghai, China 201210 Wokingham, Berkshire Germany
www.fortebio.com fortebio.info@moldev.com salesops.china@moldev.com RG41 5TS, United Kingdom + 00800 665 32860
+44 118 944 8000
uk@moldev.com
©2019 Molecular Devices, LLC. All trademarks used herein are the property of Molecular Devices, LLC. Specifications subject to change without
notice. Patents: www.moleculardevices.com/product patents. FOR RESEARCH USE ONLY. NOT FOR USE IN DIAGNOSTIC PROCEDURES.
AN-4017 Rev C