


Validated quantitation and activity assay of antibody fragmen...
ホワイトペーパー
このカタログについて
| ドキュメント名 | Validated quantitation and activity assay of antibody fragmen... |
|---|---|
| ドキュメント種別 | ホワイトペーパー |
| ファイルサイズ | 1.4Mb |
| 取り扱い企業 | ザルトリウス・ジャパン株式会社 (この企業の取り扱いカタログ一覧) |
この企業の関連カタログ


このカタログの内容
Page1
APPLICATION NOTE 12
Validated quantitation and activity assay of
antibody fragment molecule (Fab) for process
development and quality control
Sydney Zaremba, Scientist, Analytical Science, Boehringer Ingelheim, Fremont, CA, USA
Rashi Takkar and Sriram Kumaraswamy, ForteBio, Fremont, CA, USA
Background tion assay are expressed in terms of percent activity of the
Fab molecule, calculated as the ratio of the Fab concentration
The analytical group at Boehringer Ingelheim, Fremont, USA determined by the Octet assay to the concentration value
needed a robust assay to measure the biological activity of determined by A280 absorption spectroscopy.
an antibody fragment (Fab) molecule for in-process testing as
well as stability and lot release testing in their Quality Control
(QC) department. LOW LIGAND CONSUMPTION
The small molecule ligand for the Fab was synthesized with a 1:1
Octet platform solution biotin:ligand molar ratio. Loading onto Streptavidin biosensors
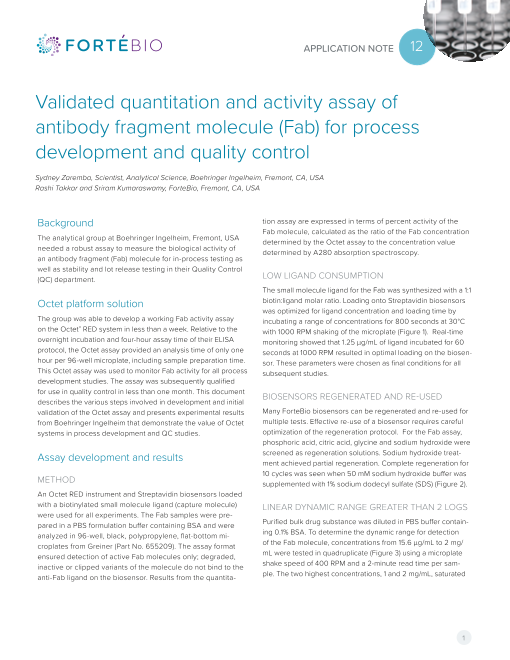
was optimized for ligand concentration and loading time by
The group was able to develop a working Fab activity assay incubating a range of concentrations for 800 seconds at 30°C
on the Octet® RED system in less than a week. Relative to the with 1000 RPM shaking of the microplate (Figure 1). Real-time
overnight incubation and four-hour assay time of their ELISA monitoring showed that 1.25 µg/mL of ligand incubated for 60
protocol, the Octet assay provided an analysis time of only one seconds at 1000 RPM resulted in optimal loading on the biosen-
hour per 96-well microplate, including sample preparation time. sor. These parameters were chosen as final conditions for all
This Octet assay was used to monitor Fab activity for all process subsequent studies.
development studies. The assay was subsequently qualified
for use in quality control in less than one month. This document
describes the various steps involved in development and initial BIOSENSORS REGENERATED AND RE-USED
validation of the Octet assay and presents experimental results Many ForteBio biosensors can be regenerated and re-used for
from Boehringer Ingelheim that demonstrate the value of Octet multiple tests. Effective re-use of a biosensor requires careful
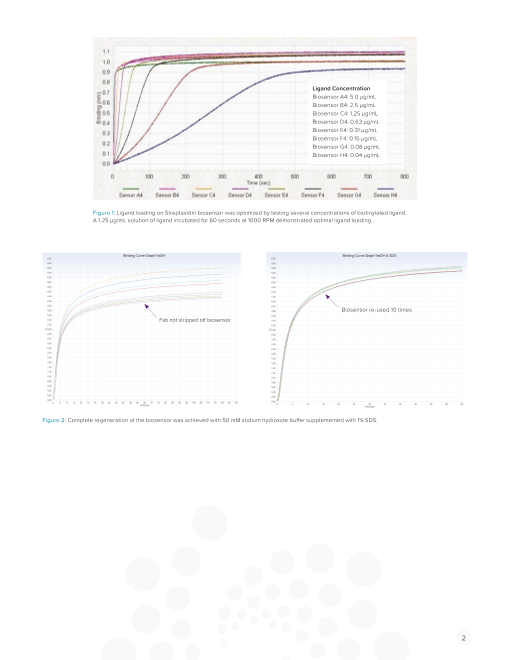
systems in process development and QC studies. optimization of the regeneration protocol. For the Fab assay,
phosphoric acid, citric acid, glycine and sodium hydroxide were
Assay development and results screened as regeneration solutions. Sodium hydroxide treat-
ment achieved partial regeneration. Complete regeneration for
10 cycles was seen when 50 mM sodium hydroxide buffer was
METHOD supplemented with 1% sodium dodecyl sulfate (SDS) (Figure 2).
An Octet RED instrument and Streptavidin biosensors loaded
with a biotinylated small molecule ligand (capture molecule) LINEAR DYNAMIC RANGE GREATER THAN 2 LOGS
were used for all experiments. The Fab samples were pre-
pared in a PBS formulation buffer containing BSA and were Purified bulk drug substance was diluted in PBS buffer contain-
analyzed in 96-well, black, polypropylene, flat-bottom mi- ing 0.1% BSA. To determine the dynamic range for detection
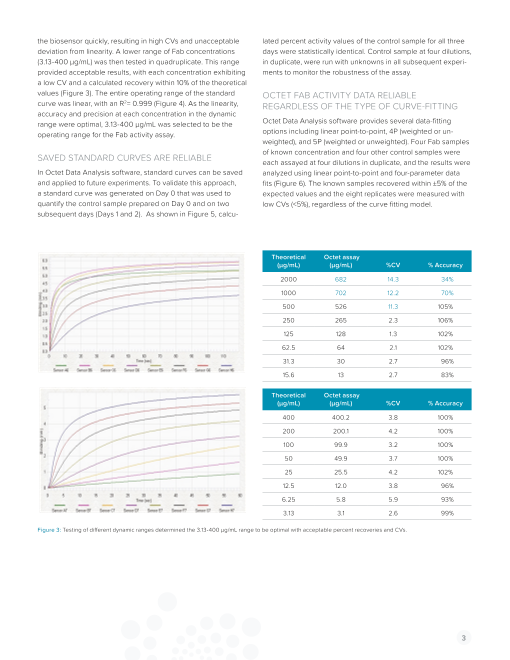
croplates from Greiner (Part No. 655209). The assay format of the Fab molecule, concentrations from 15.6 µg/mL to 2 mg/
ensured detection of active Fab molecules only; degraded, mL were tested in quadruplicate (Figure 3) using a microplate
inactive or clipped variants of the molecule do not bind to the shake speed of 400 RPM and a 2-minute read time per sam-
anti-Fab ligand on the biosensor. Results from the quantita- ple. The two highest concentrations, 1 and 2 mg/mL, saturated
1
Page2
Ligand Concentration
Biosensor A4: 5.0 µg/mL
Biosensor B4: 2.5 µg/mL
Biosensor C4: 1.25 µg/mL
Biosensor D4: 0.63 µg/mL
Biosensor E4: 0.31 µg/mL
Biosensor F4: 0.15 µg/mL
Biosensor G4: 0.08 µg/mL
Biosensor H4: 0.04 µg/mL
Figure 1: Ligand loading on Streptavidin biosensor was optimized by testing several concentrations of biotinylated ligand.
A 1.25 µg/mL solution of ligand incubated for 60 seconds at 1000 RPM demonstrated optimal ligand loading.
Biosensor re-used 10 times
Fab not stripped off biosensor
Figure 2: Complete regeneration of the biosensor was achieved with 50 mM sodium hydroxide buffer supplemented with 1% SDS.
2
Page3
the biosensor quickly, resulting in high CVs and unacceptable lated percent activity values of the control sample for all three
deviation from linearity. A lower range of Fab concentrations days were statistically identical. Control sample at four dilutions,
(3.13-400 µg/mL) was then tested in quadruplicate. This range in duplicate, were run with unknowns in all subsequent experi-
provided acceptable results, with each concentration exhibiting ments to monitor the robustness of the assay.
a low CV and a calculated recovery within 10% of the theoretical
values (Figure 3). The entire operating range of the standard OCTET FAB ACTIVITY DATA RELIABLE
curve was linear, with an R2= 0.999 (Figure 4). As the linearity, REGARDLESS OF THE TYPE OF CURVE-FITTING
accuracy and precision at each concentration in the dynamic
range were optimal, 3.13-400 µg/mL was selected to be the Octet Data Analysis software provides several data-fitting
operating range for the Fab activity assay. options including linear point-to-point, 4P (weighted or un-
weighted), and 5P (weighted or unweighted). Four Fab samples
of known concentration and four other control samples were
SAVED STANDARD CURVES ARE RELIABLE each assayed at four dilutions in duplicate, and the results were
In Octet Data Analysis software, standard curves can be saved analyzed using linear point-to-point and four-parameter data
and applied to future experiments. To validate this approach, fits (Figure 6). The known samples recovered within ±5% of the
a standard curve was generated on Day 0 that was used to expected values and the eight replicates were measured with
quantify the control sample prepared on Day 0 and on two low CVs (<5%), regardless of the curve fitting model.
subsequent days (Days 1 and 2). As shown in Figure 5, calcu-
Theoretical Octet assay
(µg/mL) (µg/mL) %CV % Accuracy
2000 682 14.3 34%
1000 702 12.2 70%
500 526 11.3 105%
250 265 2.3 106%
125 128 1.3 102%
62.5 64 2.1 102%
31.3 30 2.7 96%
15.6 13 2.7 83%
Theoretical Octet assay
(µg/mL) (µg/mL) %CV % Accuracy
400 400.2 3.8 100%
200 200.1 4.2 100%
100 99.9 3.2 100%
50 49.9 3.7 100%
25 25.5 4.2 102%
12.5 12.0 3.8 96%
6.25 5.8 5.9 93%
3.13 3.1 2.6 99%
Figure 3: Testing of different dynamic ranges determined the 3.13-400 µg/mL range to be optimal with acceptable percent recoveries and CVs.
3
Page4
500
y = 1.005x ± 0.0204
R2 = 0.9989
400
300
200
100
0
0 100 200 300 400 500
Theoretical Concentration (µg/mL)
Figure 4: Linearity of the Fab assay in the 3.13-400 µ1g.6
Standard
/mL ranKgneow. n and Control
Linear Point to Point
101%, %CV = 1.9%
1.2 Octet assay
Control lot Day A280 (µg/mL) (µg/mL) % Activity
1 Day 0 7680 7610 99
1 Day 1 7680 0.8 7745 101
1 Day 2 7680 7670 100
2 Day 0 7680 7290 95
1.0
2 Day 1 7680 7551 98
2 Day 2 7680 7528 98
Figure 5: The performance of saved standard curves for Fab quantitation.00 80 160 240 320 400 480
Concentration (µg/mL)
1.6 Standard Standard
Known and Control Known and Control
Linear Point to Point 1.2 4 PL
101%, %CV = 1.9% 100%, %CV = 2.2%
1.2
0.8
0.8
1.0
1.0
0 0
0 80 160 240 320 400 480 0 80 160 240 320 400 480
Concentration (µg/mL) Concentration (µg/mL)
Figure 6: Known and control samples recovered within ±10% of expected values and the eight replicates produced very low CVs (<5%) for all curve
fits evaluated.
Standard
Known and Control
1.2 4 PL
100%, %CV = 2.2%
4
0.8
1.0
0
0 80 160 240 320 400 480
Concentration (µg/mL)
Binding Rate Binding Rate
Octet concentration (µg/mL)
Binding Rate Binding Rate
Page5
SPECIFIC DETECTION OF FAB FRAGMENTS IN THE of the sample, i.e., 50% purity yielded 49% activity and 5% purity
PRESENCE OF MONOCLONAL ANTIBODIES yielded 4.2% activity (Figure 8). The Octet assay demonstrated
excellent accuracy for the Fab molecule over the entire range of
Six different monoclonal antibodies were titrated and tested impurity levels.
with the Octet assay. None of the six antibodies produced a
binding signal, demonstrating the high specificity of the Octet
assay for the Fab molecule (Figure 7). OCTET ASSAY COMPLEMENTS A280
SPECTROSCOPY FOR IN-PROCESS TESTING
EXCELLENT ACCURACY A280 spectroscopy cannot differentiate between the Fab
During Fab production, the culture medium contains many host molecule and in-process impurities, instead measuring total
cell proteins in addition to the Fab. The assay must display high protein concentration in the sample. The Octet assay specifical-
specificity for the intact Fab molecule in the presence of these ly detected the Fab molecule in the presence of impurities. The
impurities during the purification process. To test for assay Fab concentration values reported by the two methods showed
specificity and accuracy, Fab samples were enriched for one that the first purification step resulted in a partially purified sam-
of the major host cell contaminants. The purity of the samples ple containing approximately 15% of a major host cell impurity
was verified by size exclusion chromatography and capillary (Figure 9), and was confirmed by a secondary method.
electrophoresis, and determined to be of 50% and 5% Fab Octet values correlated very well (within 5%) with A280 spec-
content. The enriched impurity samples were run in the assay troscopy values for the purified Fab molecule following the first
and the percent activity directly correlated with percent purity purification step (Figure 9).
Figure 7: Absence of signal for six monoclonal antibodies tested.
Octet assay
Sample (µg/mL) A280 (µg/mL) %CV % Activity % Accuracy
99% Fab 49100 50500 5.0 97 98
50% Fab 430 880 6.7 49 98
5% Fab 46 1100 3.3 4.2 84
Figure 8: Results indicate excellent selectivity and accuracy for Fab fragment in the presence of major host cell impurity.
Octet assay A280 % Major
Sample (µg/mL) (µg/mL) %CV % Activity impurity
First purification step 7680 9500 2.6 81 15%
First intermediate step 4220 4380 4.4 96 <1%
Second intermediate step 7570 7680 1.8 99 <1%
Final purification step 67880 65790 7.6 103 <1%
Bulk drug substance 50100 49500 5.0 101 <1%
Figure 9: Octet assay correlated with A280 spectroscopy for the detection of purified Fab molecule, and showed
specificity for Fab molecule in the presence of major host cell impurity.
5
Page6
Repeatability (n = 8)
97%
95%
101%
99%
100%
99%
90%
96%
Avg = 97%
%CV = 3.6
Figure 10: Fab activity assay demon-
strated high intra-mediate precision, or
repeatibility, with CVs below 3.6%.
Means and standard deviations
Std error Lower Upper
Level Number Mean Std dev mean 95% 95%
1 26 102.923 4.83258 0.9477 100.97 104.87
2 10 101.200 6.98888 2.2101 96.20 106.20
n = 36 % Activity %CV
Avg 102 5.3
Oneway analysis of % activity by analyst
125
115
100
110
75
105
50
100
95 25
90
1 2 0
0 10 20 30 40
Analyst All pairs Number of Assays
Tukey-Kramer
0.05
Figure 11: Good intermediate precision was observed. The average activity for the Fab control samples was 102% with a CV of only 5.3% for 36 runs.
6
% Activity
% Activity
Page7
OCTET FAB ASSAY DISPLAYED GOOD PRECISION Conclusion
Precision (repeatability) was evaluated by analyzing the assay The activity assay developed by Boehringer Ingelheim, Fre-
control sample independently diluted eight times in a single mont, USA for their Fab molecule is currently being used for
analytical run (Figure 10). The Fab activity assay demonstrated lot release and stability testing within the QC department. The
acceptable repeatability with a 3.6% CV for the eight inde- assay has faster turn around times than ELISA and Biacore
pendently diluted control samples. Intermediate precision was systems. The Fab activity assay is accurate and robust, with
determined by running the purified Fab control sample on 36 intermediate and intramediate precision less than 10%. Drug
different occasions by two different operators from different activity measurement using the Octet system has become a
laboratories. The average percent activity was 102% with a CV critical parameter for their product evaluation, and has resulted
of only 5.3% for all runs (Figure 11). in increased Fab drug product consistency and quality. The
activity data generated on the Octet system may be submitted
to regulatory agencies for evaluation.
ForteBio ForteBio Analytics (Shanghai) Co., Ltd. Molecular Devices (UK) Ltd. Molecular Devices (Germany) GmbH
47661 Fremont Boulevard No. 88 Shang Ke Road 660-665 Eskdale Bismarckring 39
Fremont, CA 94538 Zhangjiang Hi-tech Park Winnersh Triangle 88400 Biberach an der Riss
888.OCTET-75 or 650.322.1360 Shanghai, China 201210 Wokingham, Berkshire Germany
www.fortebio.com fortebio.info@moldev.com salesops.china@moldev.com RG41 5TS, United Kingdom + 00800 665 32860
+44 118 944 8000
uk@moldev.com
©2019 Molecular Devices, LLC. All trademarks used herein are the property of Molecular Devices, LLC. Specifications subject to change without
notice. Patents: www.moleculardevices.com/product patents. FOR RESEARCH USE ONLY. NOT FOR USE IN DIAGNOSTIC PROCEDURES.
AN-4012 Rev C